SOL Price Prediction: Can the Digital Asset Rebound to $200?

#SOL
SOL Price Prediction
SOL Technical Analysis: Bearish Signals Dominate Short-Term Outlook
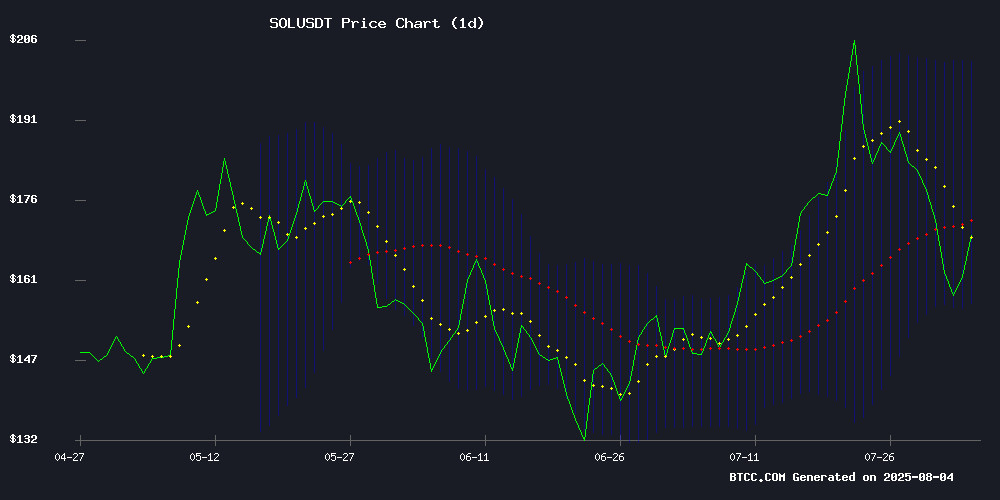
SOL is currently trading at, significantly below its 20-day moving average of 179.0240, indicating bearish momentum. The MACD histogram shows a positive crossover (9.7701), but remains DEEP in negative territory at -7.8868, suggesting weak buying pressure. Bollinger Bands show price hugging the lower band at 156.0497, typically signaling oversold conditions.
"The technical picture suggests SOL may retest support at $150 before any meaningful recovery," said John, BTCC financial analyst. "Traders should watch for a close above the middle Bollinger Band at 179.0240 to confirm trend reversal."
Mixed Signals for SOL: ETF Hopes vs. Competitive Threats
The SEC's potential approval of solana ETFs could provide major institutional support, while long-term holders accumulating during price dips shows strong conviction. However, emerging competitors like Unilabs gaining regulatory traction in key markets like UAE may challenge SOL's market position.
"ETF approval would be transformative, but SOL needs to hold $160 support to maintain bullish structure," noted John. "The Unilabs development bears watching - regulatory clarity attracts capital, but may fragment the LAYER 1 market."
Factors Influencing SOL's Price
Major Asset Managers Vie for SEC Approval on Solana ETFs
Wall Street's push into crypto diversification has reached Solana, with at least six asset management firms filing for spot ETF approvals since June 2024. VanEck's pioneering S-1 registration kicked off a wave that now includes 21Shares, Bitwise, and Grayscale—all seeking to convert existing trusts or launch new products on exchanges like Cboe BZX and NYSE Arca.
The filings signal institutional demand for exposure beyond Bitcoin and Ethereum, with Solana's scalable blockchain attracting fund managers. Franklin Templeton's dual S-1/19b-4 filing in March 2025 underscores the competitive timeline, while post-election submissions from Canary suggest regulatory strategy shifts.
Solana Long-Term Holders Accumulate Amid Price Dip
Solana's SOL token has declined 14% over the past week, testing crucial support at $158.80 after failing to sustain momentum from its July 22 cycle high of $206. The current price of $160.55 reflects weakened short-term trader confidence, but on-chain metrics reveal a contrasting narrative of strategic accumulation by veteran investors.
Glassnode data shows a 102% surge in long-term holder positions since July 30, with coins increasingly moving to cold storage. The realized Profit/Loss Ratio hitting a 30-day low of 0.15 indicates most sellers are capitulating at losses, while declining Liveliness metrics confirm reduced selling pressure from diamond hands. This accumulation pattern suggests institutional players view current levels as an attractive entry point.
Technical analysts note the $158.80 support level remains pivotal, with a breakout above $176.33 potentially signaling renewed bullish momentum. The divergence between price action and holder behavior mirrors accumulation patterns seen during previous market bottoms.
Unilabs Gains Momentum with CoinMarketCap Listing and UAE Regulatory Support, Potential Challenger to Solana
Solana's price volatility has left investors searching for alternatives, with Unilabs Finance emerging as a contender. Rumors of a CoinMarketCap listing and regulatory backing in the UAE position Unilabs for growth in the smart contract arena. Analysts suggest it could eclipse Solana's hype—including the anticipated SOL ETF—by 2028.
Institutional interest in Solana persists, with Grayscale, Fidelity, and VanEck revising their SOL ETF filings to align with SEC expectations. Despite a 10% weekly drop to $160, market watchers assign a 95% probability of ETF approval by September. Such approval could reignite momentum, though uncertainties linger.
How High Will SOL Price Go?
Based on current technicals and market developments, SOL faces resistance at key levels:
| Price Level | Significance |
|---|---|
| $179.02 | 20-day MA & middle Bollinger Band |
| $201.99 | Upper Bollinger Band resistance |
| $150.00 | Psychological support level |
"A breakout above $180 could target $200 by September," said John. "However, failure to hold $160 may see a drop to $140 before institutional buyers step in."
- Technical Pressure: SOL trades below key moving averages with oversold Bollinger Band signals
- ETF Catalyst: SEC approval of Solana ETFs could drive institutional inflows
- Competitive Landscape: Emerging Layer 1 chains may impact SOL's market share
